Debugging Win32 binaries in Ghidra via Wine

Ghidra is a cross-platform reverse-engineering and binary analysis tool, with recent versions including support for dynamic analysis. I want to try using it as a replacement for IDA Pro in reverse-engineering of Win32 binaries, but hit bugs related to address space detection when running gdbserver with Wine (ghidra#4534).
This post contains custom GDB commands that allow Ghidra to query the Linux process ID and memory maps of a Win32 target process running in 32-bit Wine on a 64-bit Linux host.
Building a simple Win32 binary on Linux
If you've already got a Win32 binary you're interested in analyzing, you can skip this step.
For the purposes of testing and writing blog posts, it's useful to have a simple "hello world" binary that doesn't have much fancy stuff going on. This is the code to a minimal Win32 console program:
#include <windows.h>

static const char message[] = "Hello, world!\n";
static const int message_len = sizeof(message);

int __stdcall mainCRTStartup(void) {
    HANDLE stdout = GetStdHandle(STD_OUTPUT_HANDLE);
    DWORD bytes_written;
    WriteFile(stdout, message, message_len, &bytes_written, NULL);
    return 0;
}
To compile a PE binary in Linux you can either use Wine to install the Windows SDK, or use a cross-compiler. The Windows SDK is a bit of a pain to install since it's distributed as an ISO image full of installer wizards, so I choose the second option. For cross-compilation I prefer to use Clang and LLD whenever possible since they're "native" cross-compilers, which means that (unlike GNU GCC/LD) their target platform can be selected at runtime.
WINE="${HOME}/.opt/wine-7.15"
clang -target i386-pc-win32 -O2 -c \
#   -isystem "${WINE}"/include/wine/windows \
#   -isystem "${WINE}"/include/wine/msvcrt \
#   hello-win32.c
ld.lld -flavor link \
#   /out:hello-win32.exe \
#   /nxcompat:no \
#   /subsystem:console \
#   /defaultlib:kernel32 \
#   hello-win32.o
If you don't have a copy of kernel32.lib from the Windows SDK, a usable substitute can be generated from kernel32.spec in Wine's source tree.
WINE_SRC="${HOME}/src/third_party/winehq.org/wine-7.15"
"${WINE}"/bin/winebuild --def \
#   -E "${WINE_SRC}"/dlls/kernel32/kernel32.spec \
#   -o kernel32.def
llvm-dlltool -m i386 -k -d kernel32.def -l kernel32.lib
Double-check that the executable works:
wine hello-win32.exe
# Hello, world!
Debugging with gdbserver.exe
First, install both Linux and Windows builds of GDB, configured with --target=i686-w64-mingw32. On Ubuntu an appropriate build of GDB can be installed with apt install gdb-mingw-w64 gdb-mingw-w64-target.
The gdbserver.exe process will run "inside" Wine, and use Windows debugging APIs to control the binary being debugged. It listens on a TCP socket implementing the GDB remote serial protocol.
wine /usr/share/win32/gdbserver.exe localhost:10000 ./hello-win32.exe
# Listening on port 10000
The i686-w64-mingw32-gdb process runs in the Linux environment, and provides a REPL that can control the "remote" gdbserver. This process is necessary because Ghidra doesn't directly speak the GDB serial protocol, it controls GDB through the text UI. Before starting up Ghidra, verify that the GDB bits are working:
/usr/bin/i686-w64-mingw32-gdb
file ~/ghidra/hello-win32.exe
# Reading symbols from ~/ghidra/hello-win32.exe...
# (No debugging symbols found in ~/ghidra/hello-win32.exe)
target extended-remote :10000
# Remote debugging using :10000
# Reading C:/windows/system32/ntdll.dll from remote target...
# warning: File transfers from remote targets can be slow. Use "set sysroot" to access files locally instead.
# Reading C:/windows/system32/kernel32.dll from remote target...
# Reading C:/windows/system32/kernelbase.dll from remote target...
# 0x7bc7eb01 in ?? ()
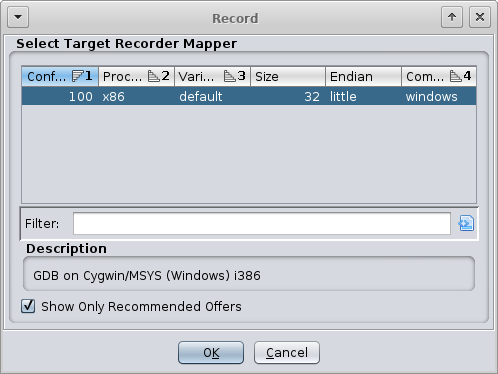
Connecting Ghidra to GDB
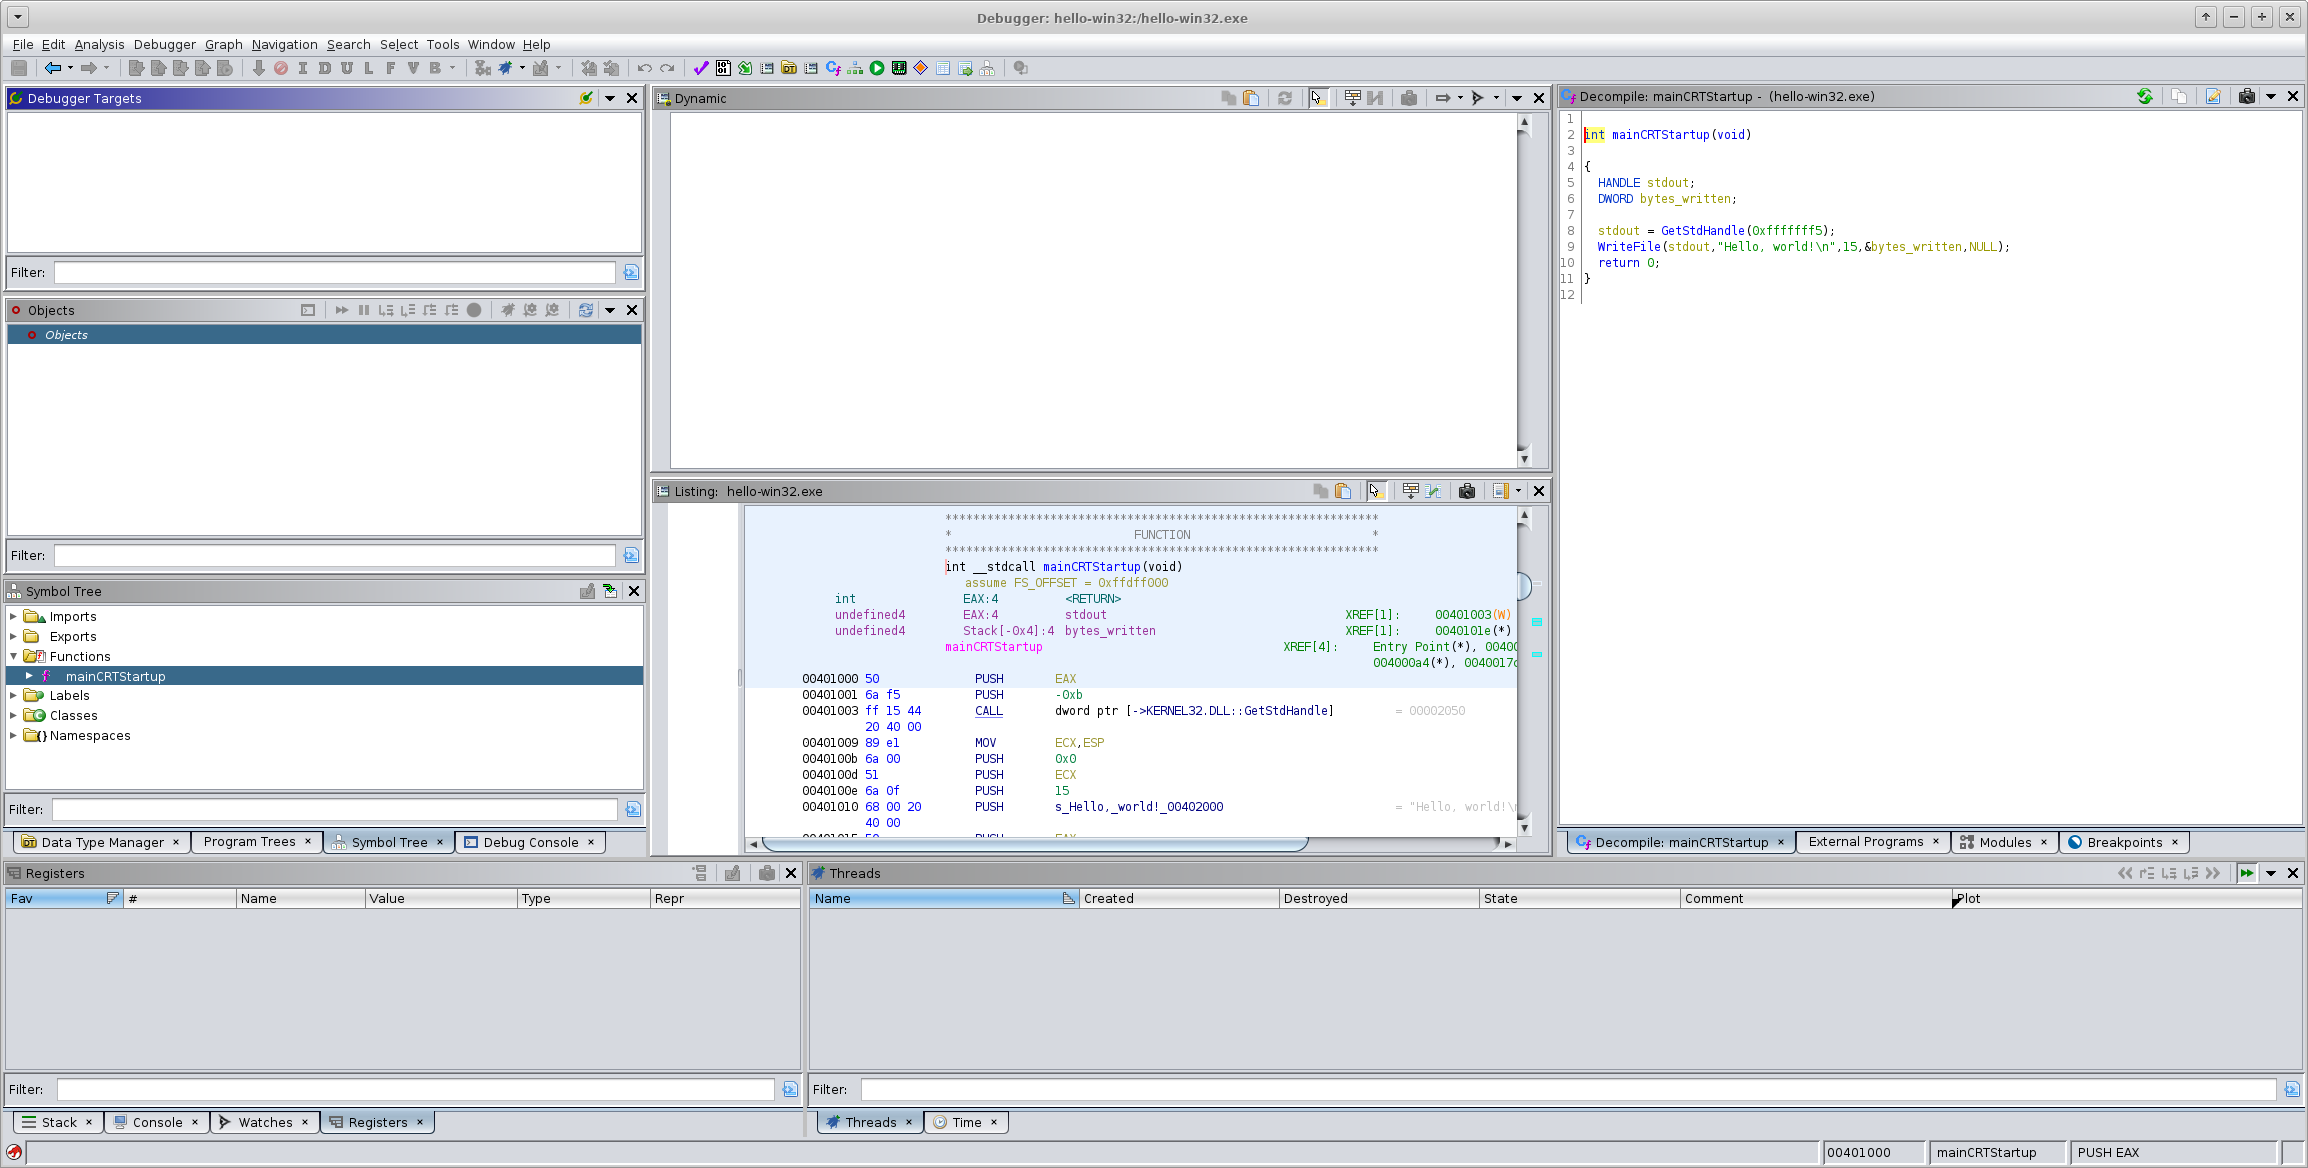
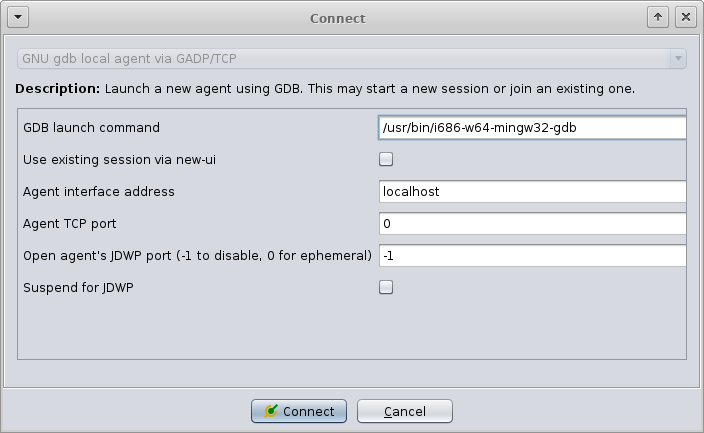
Create the Ghidra project, import the Win32 binary to be analyzed, and enter the Debugger tool. When connecting to GDB you can use either IN-VM or GADP, but GADP is probably better since Ghidra's debugger can get wedged and it's nice to be able to forcefully disconnect by killing the GADP agent.
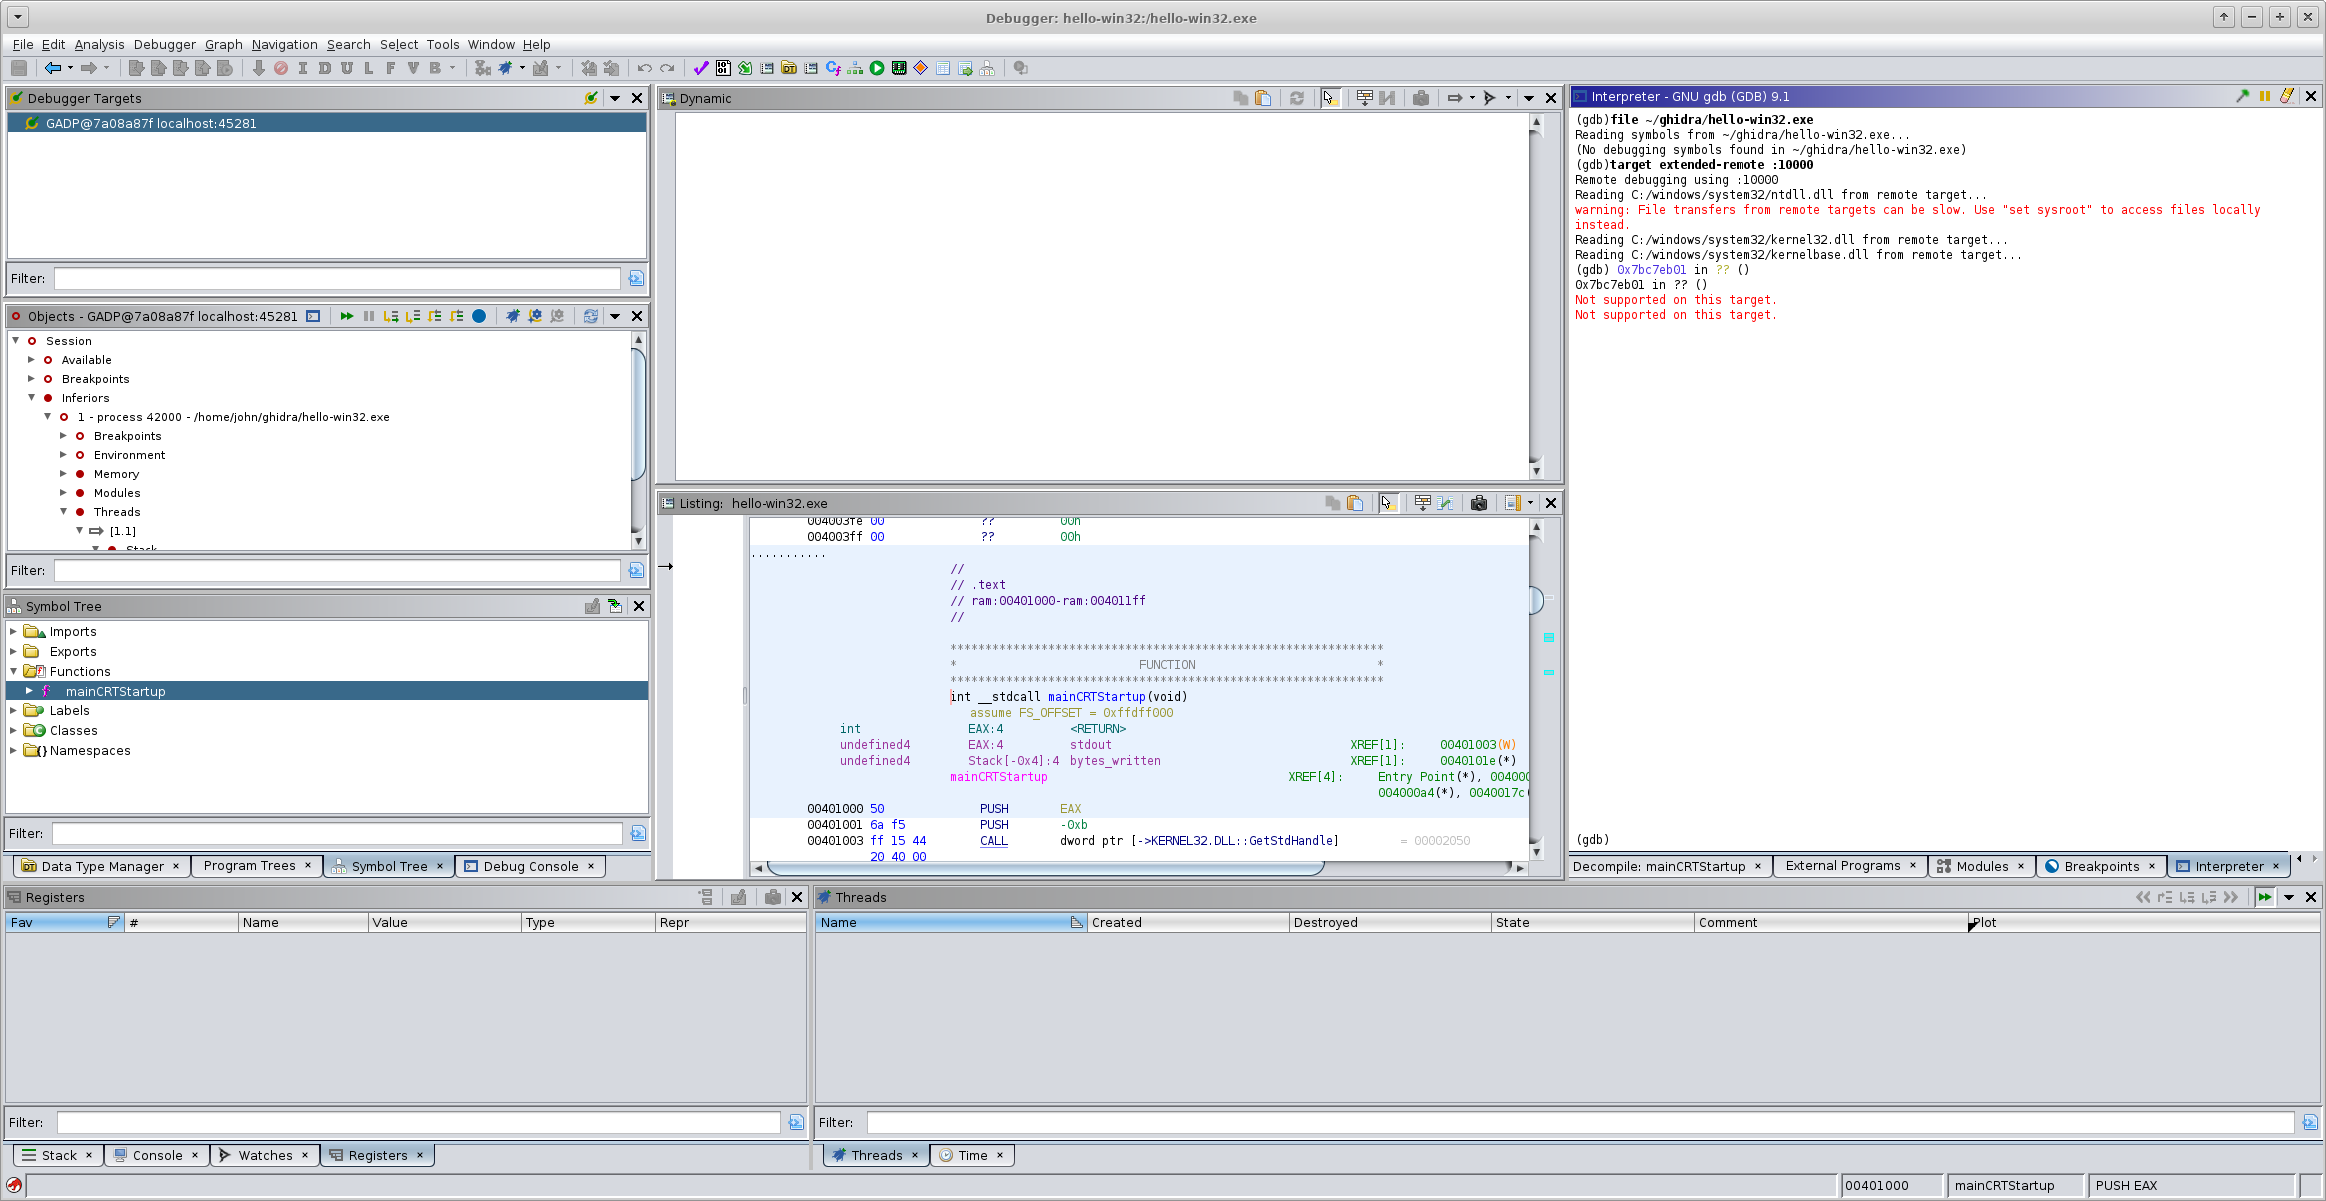
Here's where things start to go wrong. After creating the trace record, Ghidra will start throwing out error popups about trying to access invalid address space. Github issue ghidra#4534 has some of the nitty-gritty details on what's going on, but in summary Ghidra depends on the GDB command info proc mappings to figure out what it can peek at, and GDB doesn't implement that command for Windows targets.

Shimming the GDB memory map
There's two problems we're facing here:
- First, we need to get access to the /proc/{pid}/maps file corresponding to the target process, parse it, and render output that matches what Ghidra expects from GDB.
- Second, the gdbserver is running inside Wine and therefore uses Windows process IDs. There's no way to query the Linux process ID for a Windows process; such an API obviously doesn't exist in Windows, and Wine developers have declined to implement it as an extension.
The memory map parsing/formatting sounds tricky but is actually pretty straightforward because the format of info proc maps is almost the same as what GDB provides, and Ghidra doesn't care about the differences. The GDB Python API can be used to define a new remote-proc-mappings command, which reads /proc/{pid}/maps for any process accessible to the remote gdbserver.
import contextlib
import os
import threading

@contextlib.contextmanager
def pipe_fds():
    r_fd, w_fd = os.pipe()
    r_file = os.fdopen(r_fd, mode="rb")
    w_file = os.fdopen(w_fd, mode="wb")
    try:
        yield (r_file, w_file)
    finally:
        r_file.close()
        w_file.close()

class ReadThread(threading.Thread):
    def __init__(self, reader):
        super(ReadThread, self).__init__()
        self.__r = reader
        self.bytes = None

    def run(self):
        self.bytes = bytearray(self.__r.read())

def reformat_line(raw_line):
    split = raw_line.decode("utf-8").split(None, 5)
    # split[0] range
    # split[1] mode
    # split[2] offset
    # split[3] major_minor
    # split[4] inode
    # split[5] object name
    start_addr_s, end_addr_s = split[0].split("-")
    start_addr = int(start_addr_s, 16)
    end_addr = int(end_addr_s, 16)
    if len(split) == 6:
        objfile = split[5]
    else:
        objfile = ""
    return "0x{:X} 0x{:X} 0x{:X} 0x{:X} {} {}\n".format(
        start_addr, end_addr,
        end_addr - start_addr,
        int(split[2], 16),
        split[1],
        objfile,
    )

class RemoteProcMappings(gdb.Command):
    def __init__(self):
        super(RemoteProcMappings, self).__init__("remote-proc-mappings", gdb.COMMAND_STATUS)

    def invoke(self, arg, from_tty):
        argv = gdb.string_to_argv(arg)
        if len(argv) != 1:
            gdb.write("usage: remote-proc-mappings PID\n", gdb.STDERR)
            return

        remote_pid = int(argv[0])

        with pipe_fds() as (r_file, w_file):
            read_thread = ReadThread(reader = r_file)
            read_thread.start()
            maps_path = "/proc/{}/maps".format(remote_pid)
            pipe_writer_path = "/dev/fd/{}".format(w_file.fileno())
            gdb.execute("remote get {} {}".format(maps_path, pipe_writer_path))
            w_file.close()
            read_thread.join()
            raw_bytes = read_thread.bytes

        for raw_line in raw_bytes.split(b"\n"):
            if raw_line:
                gdb.write(reformat_line(raw_line))

RemoteProcMappings()
Next we need the Linux PID. Luckily(?) Wine allows Win32 binaries to directly invoke Linux syscalls via the INT 0x80 instruction, so a straightforward approach is to inject a linux_getpid() function into the target process's address space and then use GDB's call command to run it.
Many Windows binaries have executable stacks (/nxcompat:no), which makes this super easy:
define getpid-linux-i386
  # MOV eax,20 [SYS_getpid]
  # INT 0x80
  # RET
  set $linux_getpid = {int (void)}($esp-7)
  set {unsigned char[8]}($linux_getpid) = {\
    0xB8, 0x14, 0x00, 0x00, 0x00, \
    0xCD, 0x80, \
    0xC3 \
  }
  output $linux_getpid()
  echo \n
end
If the above command causes a segfault then the binary was probably compiled with /nxcompat, which places the stack in a non-executable mapping. Luckily(?) again, Windows processes map their .text segment to a fixed offset (by default 0x401000), so you can use Ghidra to locate some function padding or an unused error branch or whatever and write the getpid stub there:
define getpid-linux-i386
  # MOV eax,20 [SYS_getpid]
  # INT 0x80
  # RET
  set $linux_getpid = {int (void)}0x401020
  set {unsigned char[8]}($linux_getpid) = {\
    0xB8, 0x14, 0x00, 0x00, 0x00, \
    0xCD, 0x80, \
    0xC3 \
  }
  output $linux_getpid()
  echo \n
end
With these two custom commands defined, it's now possible to override info proc mappings to (1) find the Linux pid, and (2) report its memory mappings to Ghidra.
source ~/ghidra/getpid-linux-i386.gdb
source ~/ghidra/remote-proc-mappings.py

define info proc mappings
  python
remote_pid = gdb.execute("getpid-linux-i386", to_string=True).strip()
gdb.execute("remote-proc-mappings {}".format(remote_pid))
  end
end
Put that into a wine-win32.gdb file and source it from Ghidra's GDB interpreter panel. Note that to make Ghidra happy the info proc mappings command must be overridden before connecting to the remote gdbserver.
Since they're regular GDB commands, they can also be used from the command line:
file ~/ghidra/hello-win32.exe
# Reading symbols from ~/ghidra/hello-win32.exe...
# (No debugging symbols found in ~/ghidra/hello-win32.exe)
source ~/ghidra/wine-win32.gdb
target extended-remote :10000
# Remote debugging using :10000
# Reading C:/windows/system32/ntdll.dll from remote target...
# warning: File transfers from remote targets can be slow. Use "set sysroot" to access files locally instead.
# Reading C:/windows/system32/kernel32.dll from remote target...
# Reading C:/windows/system32/kernelbase.dll from remote target...
# 0x7bc7eb01 in ?? ()
getpid-linux-i386
# 1872324
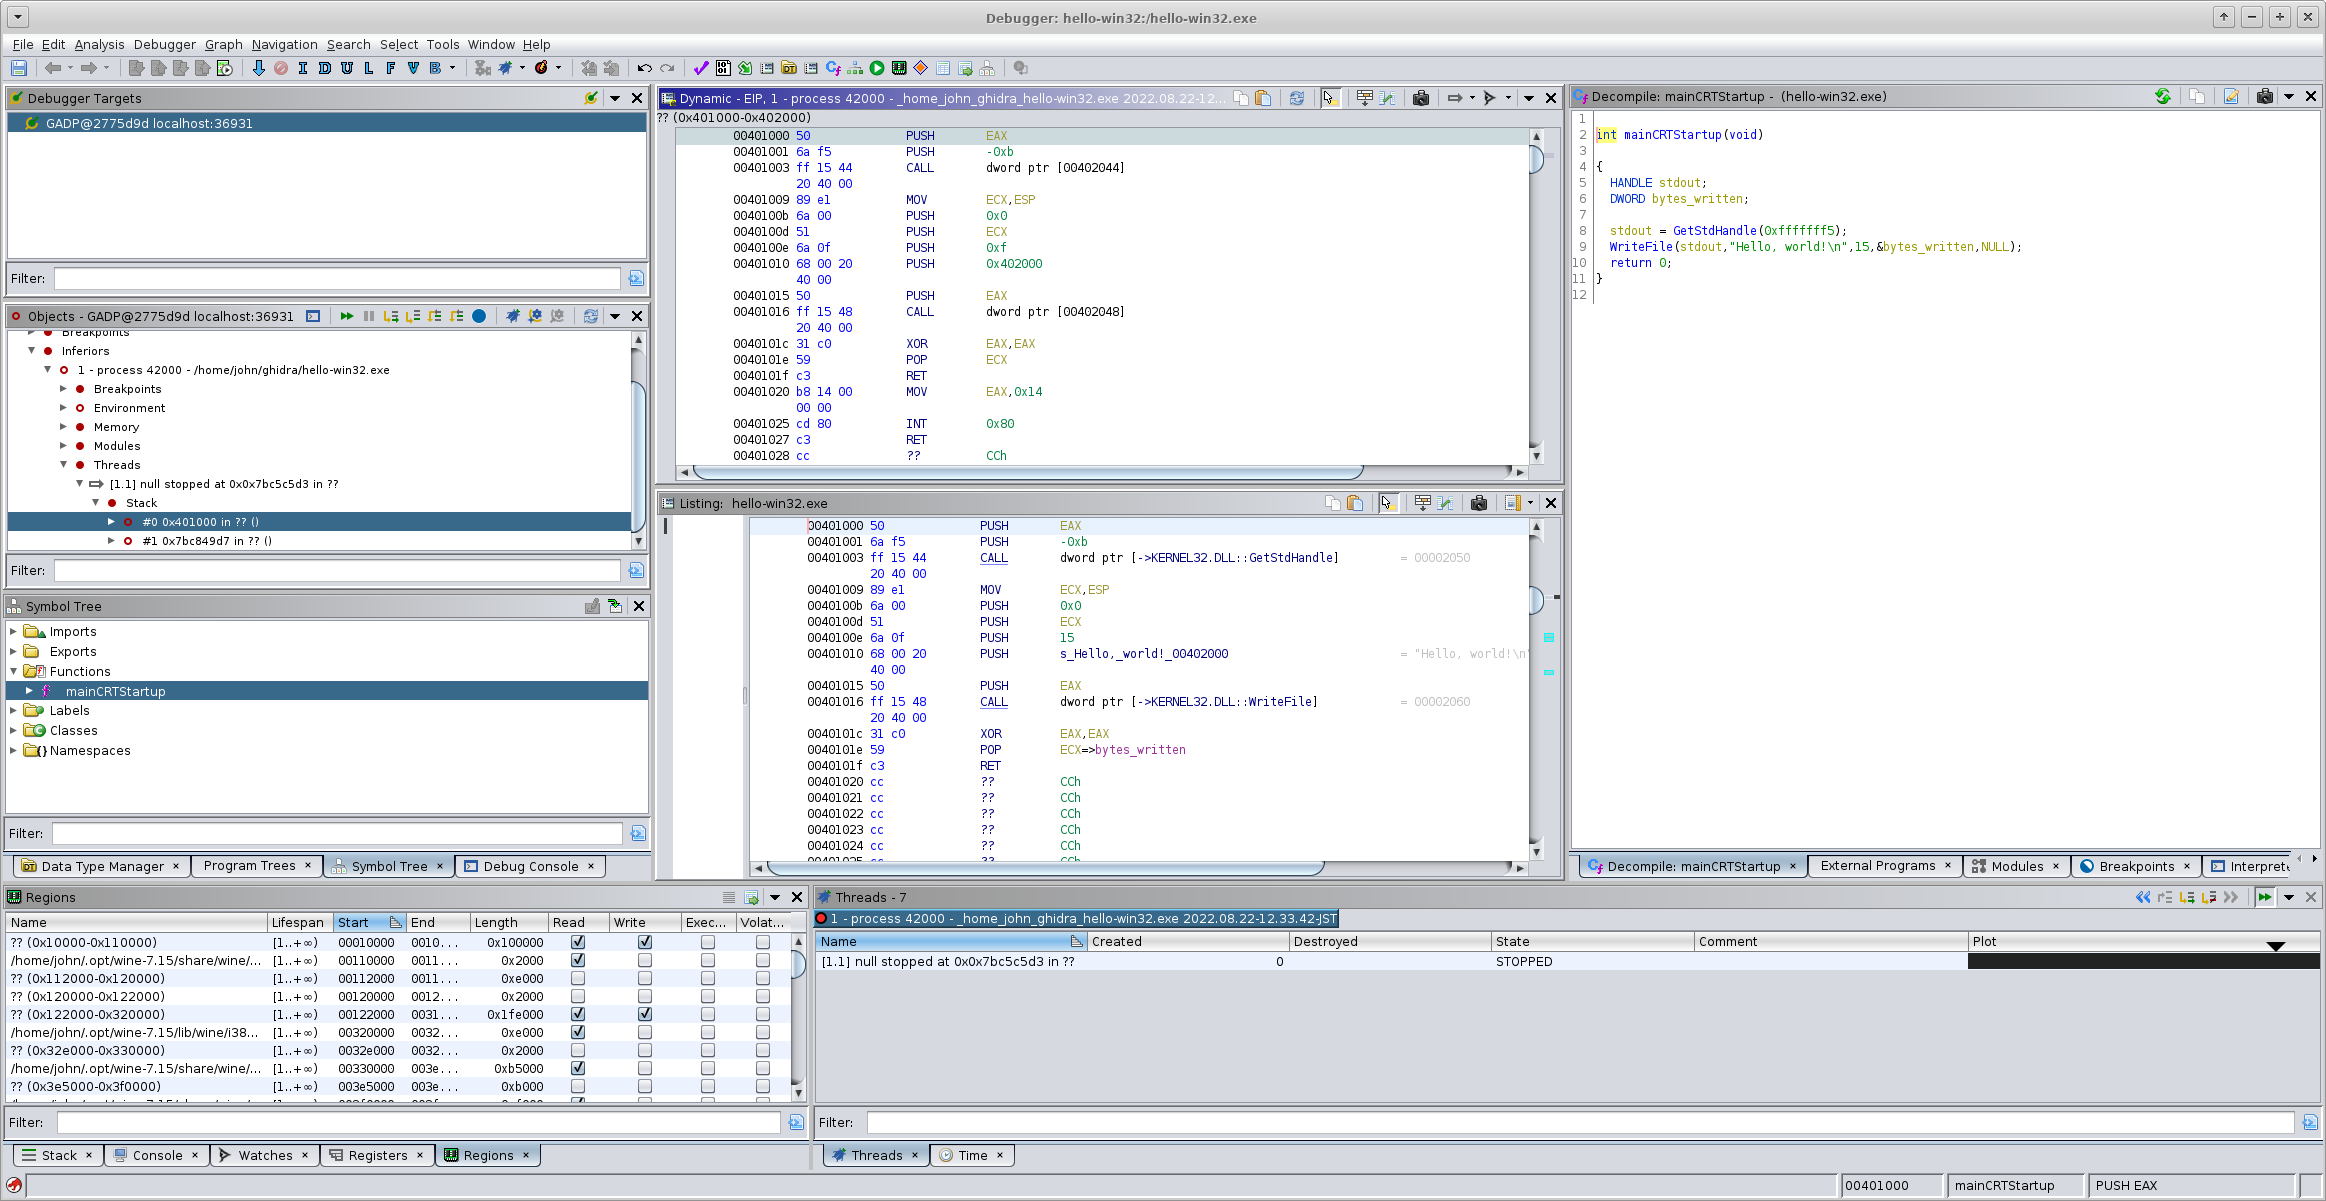
When loaded into Ghidra's GDB session, the trace recording works and the dynamic analysis functionality (Dynamic panel, Regions panel, etc) work as expected.
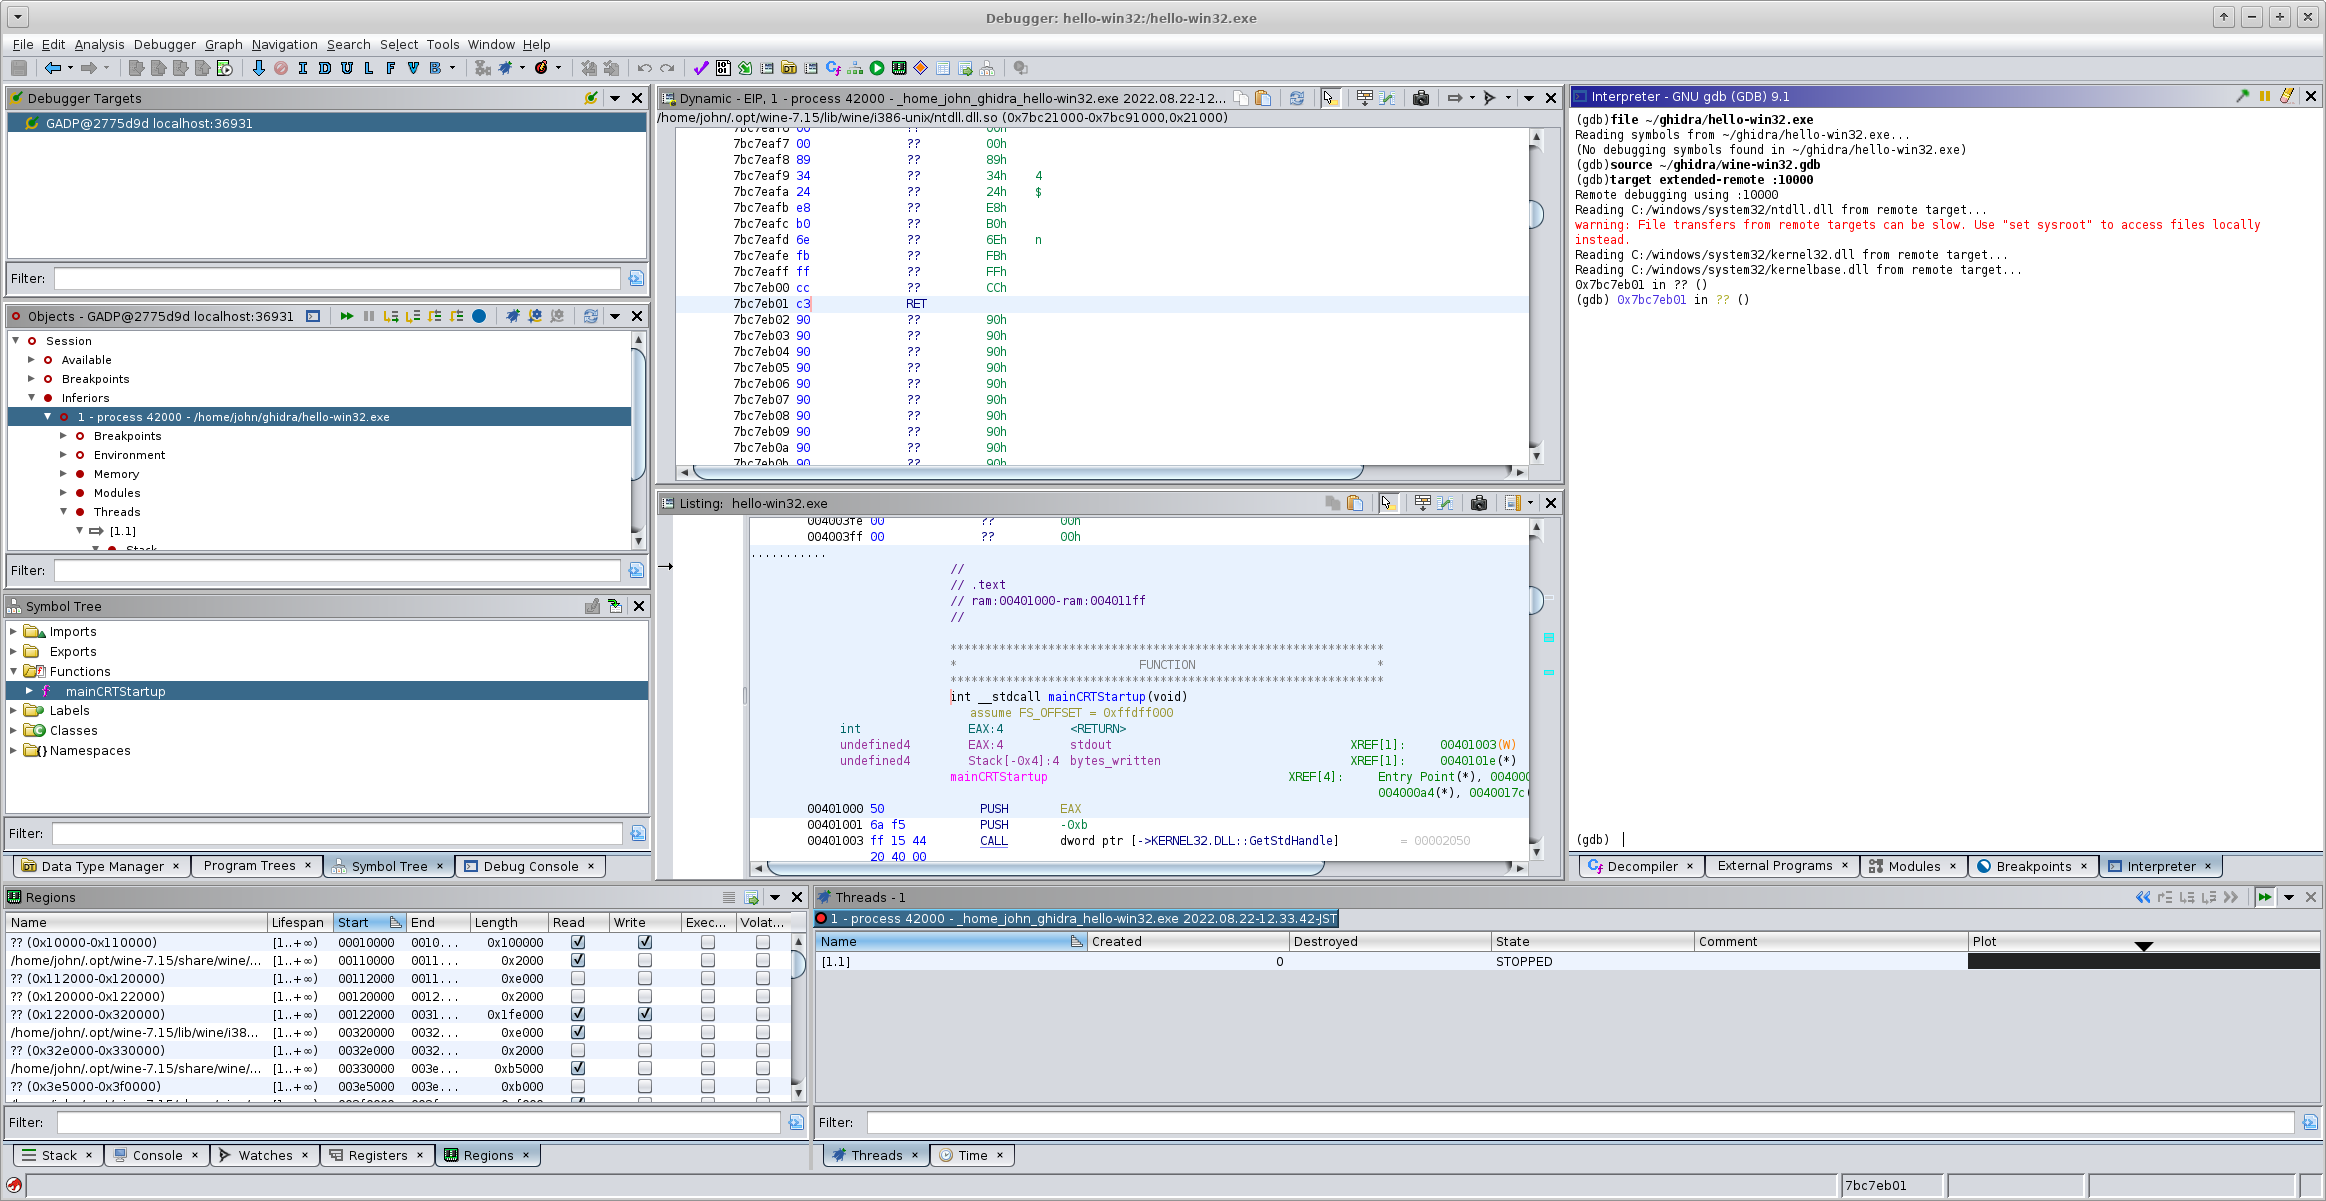
Ghidra is able to disassemble code injected at runtime. Here, the Dynamic panel shows our linux_getpid code injected at 0x401020.